

Eleven interconnected AI/Tech companies are valued at a combined $27T as of July 2026. While each company individually has a plausible path to success, what you have to believe for the collection as a whole should give you real pause.
I think the hardest challenge for investors in 2026 is the discomfort so many of us feel about Mega-Cap Technology valuations. There’s a large and growing concern about “The AI Bubble” and what to do about if there is, indeed a bubble that bursts.
Knowing these AI companies are “expensive relative to earnings” is one thing. It’s quite another to actually understand what story you have to believe at today’s valuations for investors to generate 10% returns per year from here.
So I modeled these companies to understand this for myself. At first, I tried to build each case individually. But, after a while, I gave up, and simply asked the inverse question of, “what has to be true for these guys to ‘win’ – in the sense that as a group, they generate 10% returns for me as an investor?”
Here’s what I found.
Using Alphabet as an Illustrative Example
Alphabet trades at 31x TTM (trailing twelve month) earnings – roughly $140B in earnings against a $4.28 trillion market cap.
(For the investment junkies who remember a different earnings number: I’m excluding a $37B unrealized gain on securities that ran through net income this past year – likely SpaceX and Anthropic, though not publicly disclosed. Note also that part of Google’s “earnings” is equity stakes in other AI and tech companies. We will come back to this observation later.)
31x is expensive for a stock, but not remarkable. The problem is that, in 2026, this number is not very helpful in evaluating Alphabet.
Over the last twelve months, Alphabet spent roughly $110 billion on capital expenditures. Almost all of it is AI infrastructure. About 60% of this spend is on the compute itself (TPUs, Google’s purpose-built AI chips), and about 40% is on the buildings, land, power, cooling, and networking around that compute.
Accounting calls that $110B an “investment” or “CapEx”. It does not touch the income statement when it’s spent, and instead it it depreciates over years. Here’s the schedule of this series of “recurring one-time investments”:
- 2025: $91.4B
- TTM: $110B
- 2026: $180-$190B (guided)
- 2027: ~$215B (CFO Anat Ashkenazi guides a “significant increase” vs. 2026; Wall Street estimates form a range, and I’m going with $215B)
Most of us have a name for “capital improvements” that recur every year, grow every year, and can’t be skipped without the asset falling behind the market. We call them expenses. Wall Street calls this one an investment.
This matters because if you call this an investment, Alphabet’s earnings still come in strong at $140B. But, if you call this an expense, Alphabet’s cash flow comes in at $64B.
This CapEx will hit the income statement, in full, over the next few years. It is already hitting the income statement to a small degree (some depreciation hits in the year of the investment). But, over the next few years, this expense will hit.
However, right now depreciation flowing through today’s income statement (mostly) comes from capex vintages half this size (yes, some depreciation from 2025 and 2026 CapEx is hitting the P&L now, but depreciation is far, far behind CapEx for now). The $185B and $215B vintages haven’t reached the P&L yet, and won’t until 2028 and 2029. When they do, over the next several years, either revenue has grown into them or reported earnings shrink toward what the cash already shows.
Earnings will reflect how this story plays out eventually. Cash flow tells it NOW.
Underwriting on Cash Flow
Swap the earnings multiple for a cash flow multiple and Google’s valuation looks like this:
TTM:
- $174B in operating cash flow
- CapEx of $110B
- Net free cash flow: $64B
- Price to TTM FCF: 71x
2026 (projected):
- $193B in operating cash flow
- CapEx of $185B
- Net free cash flow: $8B
- Price to 2026 FCF: 568x
2027 (projected):
- $230B in operating cash flow
- CapEx of ~$215B
- Net free cash flow: ~$15B
The market KNOWS that 2026 and 2027 combined will bring in roughly $20-$30B of free cash flow, at a company valued above $4 trillion, and it maintains the valuation anyway. The next two years are already conceded, by Google, by Wall Street, and really any serious analyst.
Therefore, Alphabet’s price is about a story of cash flows from 2028 and beyond.
And this story can be measured. Let’s measure this one.
What the Price Requires You to Believe
A discounted cash flow model takes your forecast and hands you a price. Run it in reverse and it takes the price and hands you the forecast the market is making. The price is a forecast. A reverse DCF just tells you what that forecast must be.
Run it on Alphabet with today’s valuation, ~$15B of 2027 free cash flow, a 10% required return and a terminal growth rate at 2.5% (perpetual growth in line with GDP after a decade of cash flow growth to justify current valuations).
A buyer at today’s price has to believe this:
Free cash flow goes from $15 billion in 2027 to $768 billion by 2036.
That’s 51x. Call it a 50%+ compound growth rate, sustained every single year for a decade. The ending number, $768B, is roughly 3x Alphabet’s entire operating cash flow today, before a dollar of CapEx.
And be honest about what the bull case actually is: it assumes the AI buildout eventually slows or stops, and Google harvests a vast profit pool from the infrastructure it built without having to reinvest at above historical rates. The improvements end. Google harvests.
This story is hard. But it is NOT crazy. I’m not arguing that Google’s valuation is silly, and I’m not betting against Google. They can win. Their AI approach is differentiated. Their market is huge and growing. Their AI investment is funded by a real, thriving, wildly profitable business.
Any single company in the “Mega Cap Complex” can tell a version of this story, and each version is individually plausible. Nvidia has a great case. Microsoft has one. Apple. Meta. Amazon. TSMC. Tesla. SpaceX. ALL of them are telling a version of this story. And, you can’t disprove ANY of the stories – because all are possible.
But, aggregate them, and the trouble starts.
Now Underwrite Eleven at Once
Google’s story – heavy spend now, harvest later – is playing out at 13 or more massive AI/tech companies that are all interconnected, and that all compete with one another. Eleven are public (OpenAI and Anthropic are excluded from the math below):
- NVIDIA – $5.14T
- Alphabet – $4.43T
- Apple – $4.59T
- Microsoft – $3.13T
- Amazon – $2.72T
- TSMC – $2.23T (not in the S&P)
- Broadcom – $1.90T
- SpaceX – $1.78T (not in the S&P)
- Meta – $1.54T
- Tesla – $1.44T
- Oracle – $378B
(Market caps as of July 13, 2026. Prices move daily – the live workbook linked at the bottom stays current, so figures here will drift a bit.)
The aggregate position:
- Combined market cap: $29.28T – 37.7% of the S&P 500, 20.9% of global equities
- Aggregate free cash flow today: $459B
- Wall Street consensus FCF: $437B (2026E) / $514B (2027E)
- EV / FCF: 63.3x, versus roughly 20-25x for the median large cap
When you run a DCF on this complex, you arrive at an implied forecast that looks like this:
This collection of some of the largest companies on Earth compounds free cash flow at 26.3% per year, every year, from 2027 through 2036.
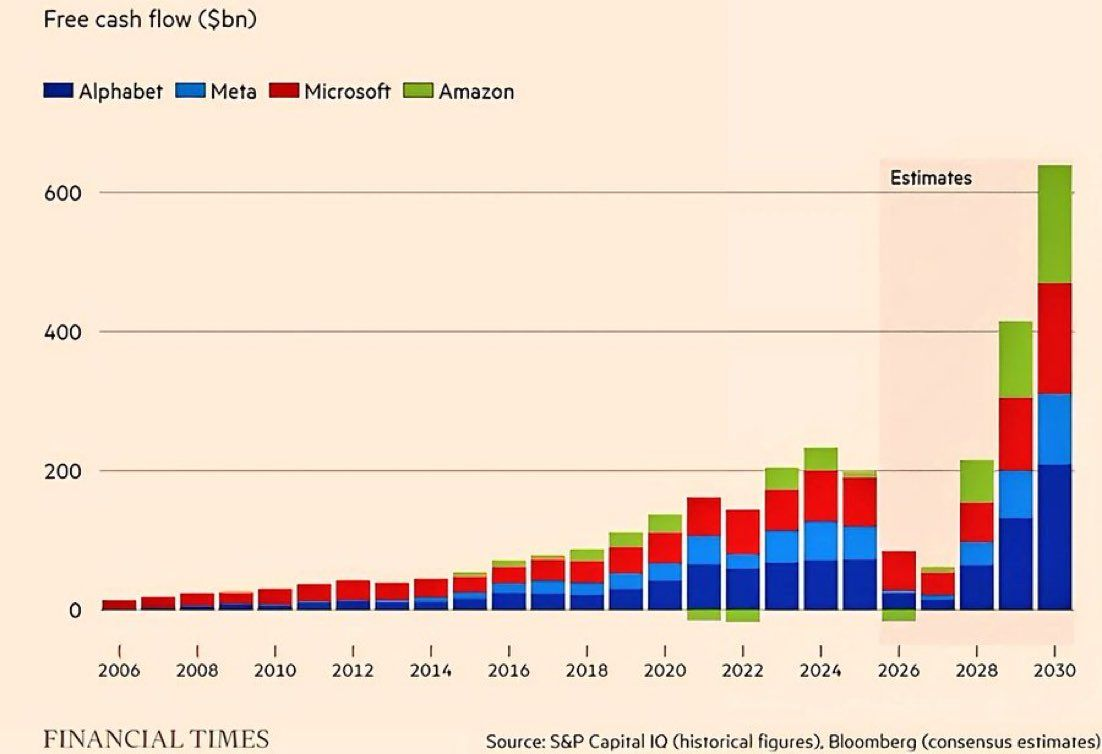
I am unable to find another study that combines the 11 public companies I have personally chosen to include in this cohort. However, I am not alone in doing this analysis. A bull (who believes these companies will win), produced the following chart, as an illustration of why these cash flows are not unreasonable for four Hyperscalers.
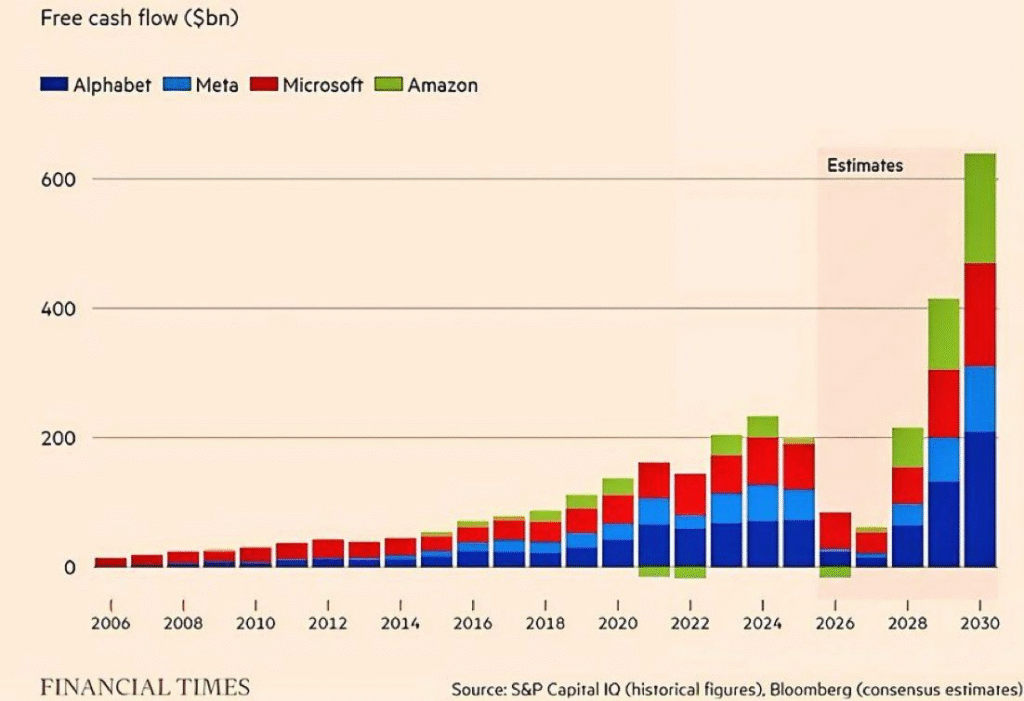
While I believe that very few serious people are, in fact, comfortable with a cash flow projection model that looks like the above, there are those who do believe it, and believe it at scale, including the suppliers and other names on my list.
However, the Reverse DCF does not get to stop at $600B in FCF for these four companies, much less the complex. By 2036, the complex must throw off $4.20 trillion in annual free cash flow. That is 9.2x the group’s free cash flow today. It’s 131% of the entire S&P 500’s earnings today, in today’s dollars. It’s 91% of all U.S. corporate profits today.
And it doesn’t stop in 2036. The model assumes the cash keeps growing forever after that.
Major problems with this forecast become obvious when observing the aggregate complex, that are very difficult to see when observing any individual company.
Problem 1: The Money Is Circular
Microsoft, Google, Amazon, Meta, and Oracle will spend an estimated ~$880B on CapEx in 2026, and a huge share of it lands as revenue at NVIDIA, Broadcom, and TSMC.
The same hyperscalers write equity checks to the AI labs – OpenAI, Anthropic, xAI – and the labs spend a meaningful chunk of it right back as cloud revenue.
One of the big talking points for Microsoft, for example, is the $625 Billion in commitments from buyers for commercial bookings, which are growing at a historic rate. $250B of that is from a single customer at OpenAI. Microsoft has invested heavily in OpenAI and reportedly owns ~27% of OpenAI.
The revenue is real. The system can create real value. It just can’t create infinite value by recycling spending inside the group. Ultimately, the aggregate free cash flow of this complex must come externally. The ultimate source of cash sits outside the ecosystem with ads, software, retail, in the outside economy.
This is really important, because a common objection to this type of analysis (bearish on Mega Cap Tech) is that the returns on AI spend are extremely strong. It is possible to make that argument within this complex. But, it is impossible to make the argument that the returns are strong from the external economy on this spend so far.
There is real business being generated externally, but it is dwarfed by the capital expenditure totals.
And, this problem (A company like Microsoft investing in AI companies like Open AI, which then share revenue back to Microsoft, become customers of the investor by committing to spend $250B at Microsoft in future years, and show up on Microsoft’s P&L as income in the form of an unrealized investment gain, driving up reported earnings) isn’t even the star of the show in this complex.
The real circularity problem is this:
For the sellers to be worth their combined $9.3 trillion, the buyers have to keep buying – CapEx up and to the right, indefinitely. For the buyers to be worth their combined $12.2 trillion, the spending has to eventually STOP so they can harvest.
NVIDIA’s bull case is Microsoft’s bear case.
Today’s index prices both growing exceptionally, perpetually. This makes sense individually. It requires an extraordinary belief set when combined.
Problem 2: The Planet Test
The second wall is scale. Planetary scale.
These figures state the requirement embedded in current prices, even after allowing for substantial growth. For this complex to deliver a 10% return, by 2036 it needs:
- Revenue of $16.80T – 6.0x today’s $2.80T ($13.1T in today’s dollars)
- Free cash flow of $4.20T – 9.2x today’s ($3.3T in today’s dollars)
- 42% of projected global corporate profits (49% of today’s pool)
- 16% of global corporate revenue
Or, translated into human beings:
- $2,025 of revenue per year from every person alive – babies included
- $506 of free cash flow extracted per person, per year
- Prefer to concentrate this spend among the affluent?
- Fine: $14,003 per affluent consumer per year – $1,167 a month from every member of every affluent household – with $3,501 of annual profit on each
The bet is that this complex effectively becomes the biggest or second-biggest budget line for every person and business on the planet.
A second bet rides along with it.
IF these companies hit these numbers – either because all or a majority of them “win” and meet their projections, or via one or two of them becoming so dominant that they generate the collective pool of free cash flow individually or as a small group, investors are also betting that the political environment will tolerate this concentration of value and power.
At 42% of the world’s corporate profits, that’s a political bet.
Is any of this impossible? No.
Is it the base case I want to pay full price for, with more than a third of my index fund? That’s the bet. I don’t like that bet.
I Tried to Talk Myself Into It
I’ve spent the past few weeks trying to believe the bull case. Four honest attempts:
First, I tried the classic: “that’s growth CapEx – strip it out and these are cash machines.” I wanted this one to work. It doesn’t. Spending that grows every year, roughly doubles in 2026, and is guided to “significantly increase” again in 2027 isn’t optional.
It’s the cost of holding your spot in the race. And the depreciation from these vintages hasn’t even reached the income statement yet. Remember – I am not arguing that these companies go bankrupt or to zero. That’s not a realistic bear case. I am arguing that if they simply grow free cash flow at 10% per year from their operational free cash flow bases today, that they will be disasters for their investors, given today’s starting prices.
Then I tried the revolution: “AI is the biggest technology shift of our lifetimes; the revenue will come.” I believe AI is real and transformative. A world-changing technology and a good investment are still different things at the wrong price. Railroads changed the world, and the investors who paid peak prices for the builders spent decades financing everyone else’s prosperity. This price doesn’t leave room for the revolution to merely happen. It needs the revolution to clear $16.8T in annual revenue for this specific group by 2036.
Next, I tried picking a winner: “the group can’t all win, so judge my champion, not the complex.” Maybe! The model I built allows users to easily exclude their “winner” or “winners” from the complex, to evaluate the remainder.
Last, I tried lowering the bar: “maybe 10% is too much to ask.” It’s my hurdle, not a law of physics, so the model lets you set your own. If your return threshold is well below 8%, then the case against this argument grows.
Where That Leaves Me
I’m not betting against NVIDIA, Google, or Meta. Any of them can win.
I’m not predicting a crash, and I don’t think any of these go to zero. I’m not timing a top, either. Expensive can stay expensive for years, and in any year this complex rips, this article will age poorly. I am used to aging poorly and have aged poorly in the past. (You have my full permission to email it back to me.)
But I am increasingly choosing not to participate in this mega-cap complex, because I simply don’t believe that, as a group, it can deliver me acceptable returns from these prices.
My thesis is perhaps best summed up as: “I’m trying to buy everything EXCEPT this complex in my stock portfolio.” Factor tilts, international, and so on. Full disclosure: I don’t love the way I’m currently expressing my own thesis, because there’s two parts to it – first this analysis, which is hotly contested, and then the analysis for the allocation I choose. I have largely settled on factor tilts, which is a second, contestable thesis on top of my preference to not buy this complex.
The principle that guides me is that I want to own things where I have to believe very little in order to win. This complex, at these prices, asks me to believe nearly everything at once.
Prove Me Wrong
A model is only as good as its inputs and framing. I’ve put real hours into both, and I’ve spent weeks hunting for the counterargument that breaks my thesis. I haven’t found it, and so far have only one person who has volunteered to challenge it.
If you know someone who believes the bull case – that this collection of companies can and will win, in aggregate – and can show me how to reframe the analysis, email me: Scott@biggerpocketsmoney.com. We’re looking for a credible analyst to come on the BiggerPockets Money podcast and present the defense of these valuations (the FAANGs, or a similar variation, works too). There are strong arguments for each company, but I am still looking for the argument agains the AI Bubble as a collection.
The numbers above comes from a free model you can play with yourself:
BiggerPocketsMoney.com/MegaCap
Discount rate, terminal growth, cash flow basis, the roster itself: all editable. Change what you disagree with, then look at what you have to believe.
Please note that I will be regularly updating this model, including in the next two weeks, as earnings calls for these Tech giants roll out. And, the argument has already softened as the complex has lost about 10% of it’s value since the original publication of my model.
None of this is investment advice. It’s my opinion and my math, offered as a budding analyst. Run your own numbers and talk to an advisor before making any investment decisions – the tool is free – and make decisions that fit your situation.


Leave a Reply